Graphvizer
Preview Graphviz in real time with Sublime Text 3
Details
Installs
- Total 5K
- Win 2K
- Mac 2K
- Linux 988
| Feb 6 | Feb 5 | Feb 4 | Feb 3 | Feb 2 | Feb 1 | Jan 31 | Jan 30 | Jan 29 | Jan 28 | Jan 27 | Jan 26 | Jan 25 | Jan 24 | Jan 23 | Jan 22 | Jan 21 | Jan 20 | Jan 19 | Jan 18 | Jan 17 | Jan 16 | Jan 15 | Jan 14 | Jan 13 | Jan 12 | Jan 11 | Jan 10 | Jan 9 | Jan 8 | Jan 7 | Jan 6 | Jan 5 | Jan 4 | Jan 3 | Jan 2 | Jan 1 | Dec 31 | Dec 30 | Dec 29 | Dec 28 | Dec 27 | Dec 26 | Dec 25 | Dec 24 | |
|---|---|---|---|---|---|---|---|---|---|---|---|---|---|---|---|---|---|---|---|---|---|---|---|---|---|---|---|---|---|---|---|---|---|---|---|---|---|---|---|---|---|---|---|---|---|
| Windows | 0 | 0 | 0 | 1 | 0 | 0 | 0 | 0 | 0 | 0 | 0 | 2 | 0 | 1 | 0 | 1 | 0 | 0 | 0 | 0 | 1 | 0 | 0 | 0 | 1 | 0 | 0 | 0 | 0 | 1 | 0 | 0 | 0 | 0 | 0 | 0 | 0 | 0 | 0 | 0 | 0 | 0 | 0 | 0 | 0 |
| Mac | 0 | 0 | 0 | 1 | 0 | 0 | 0 | 0 | 0 | 0 | 1 | 0 | 0 | 0 | 0 | 0 | 0 | 0 | 0 | 1 | 0 | 0 | 0 | 0 | 0 | 0 | 0 | 0 | 0 | 0 | 1 | 0 | 0 | 0 | 0 | 0 | 0 | 0 | 0 | 0 | 0 | 0 | 0 | 1 | 0 |
| Linux | 0 | 0 | 0 | 0 | 0 | 1 | 0 | 0 | 0 | 0 | 0 | 0 | 0 | 0 | 1 | 0 | 0 | 0 | 0 | 2 | 0 | 0 | 0 | 0 | 0 | 0 | 0 | 0 | 0 | 0 | 0 | 0 | 0 | 0 | 0 | 0 | 0 | 0 | 0 | 0 | 0 | 0 | 1 | 0 | 0 |
Readme
- Source
- raw.githubusercontent.com
Graphvizer
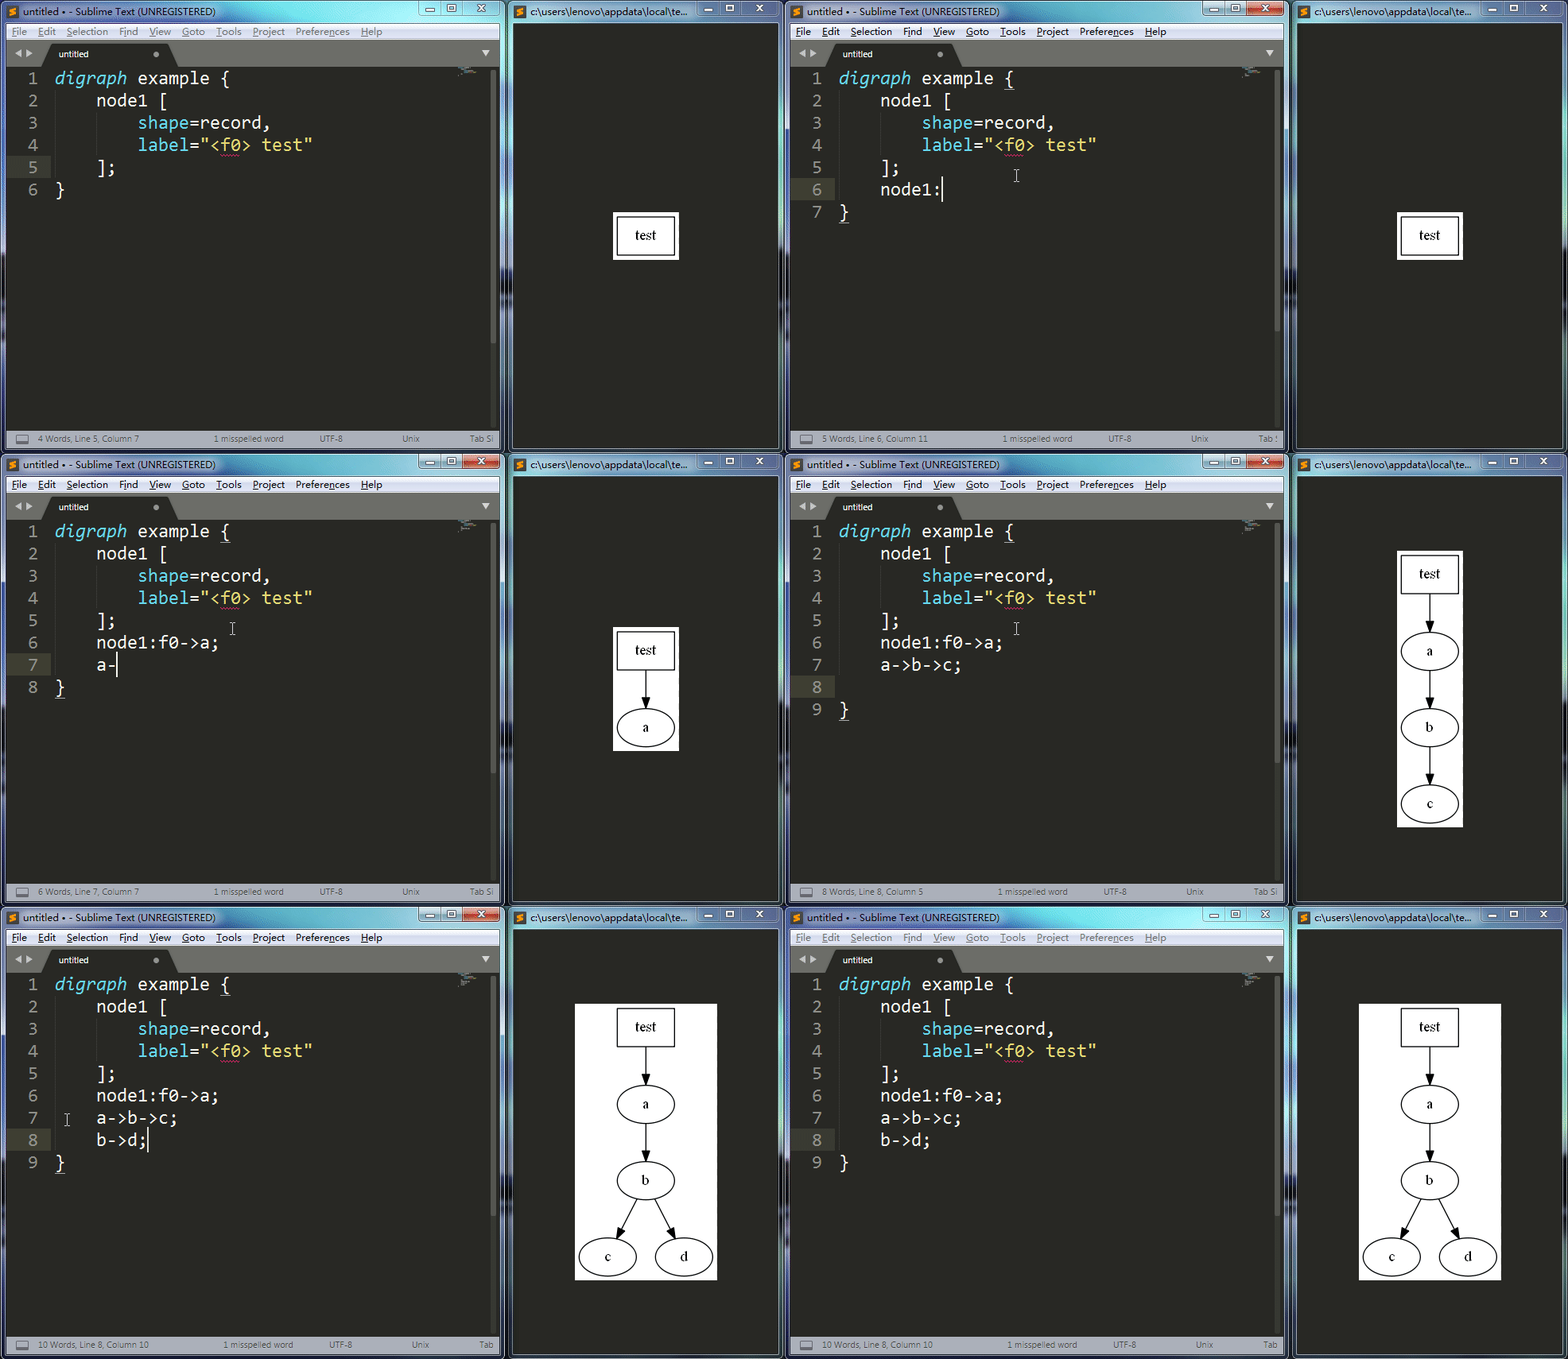
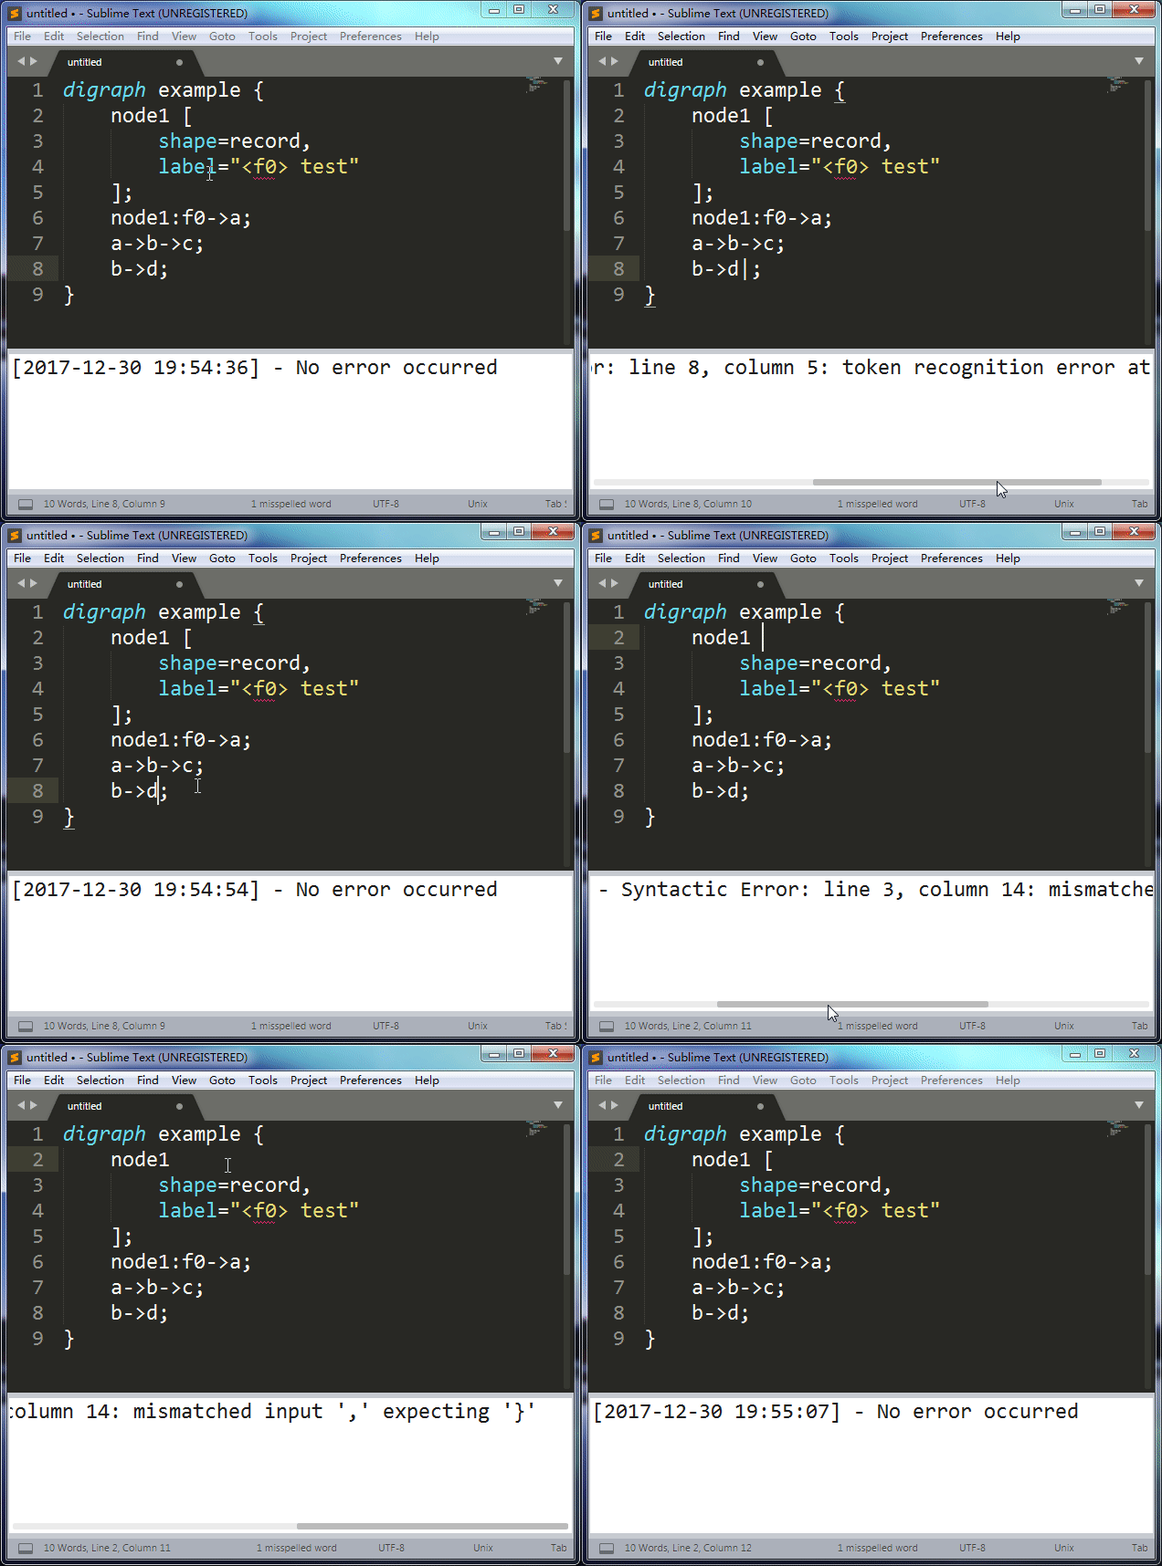
Graphvizer is a Graphviz plugin for Sublime Text 3. It can render an image automatically in real time while you edit a dot language file. All you need to do is edit your file at the speed of thought, and this plugin will do the rest for you. If your dot file has syntax errors, the plugin will display relevant messages.
Features
- Real-time rendering
- Real-time syntax checking
- Error message prompting
- Support specifying layout engine
- Support specifying output format
Usage
Note: Please ensure the file syntax is set to Graphviz (DOT). You can do this with the View -> Syntax menu or clicking the bottom right corner of Sublime Text window.
Open image window
Ctrl+Shift+G or Tools -> Graphvizer -> Open Rendered Image

Open Graphvizer panel
Ctrl+Shift+X or Tools -> Graphvizer -> Show Graphvizer Panel

Specifying layout engine
The default layout engine is dot, which can be changed in settings. You can also change it for a specific file through Tools -> Graphvizer -> Layout Engine.
Specifying output format
The default output format is png, which can be changed in settings. You can also change it for a specific file through Tools -> Graphvizer -> Output Format.
Powerful image viewer
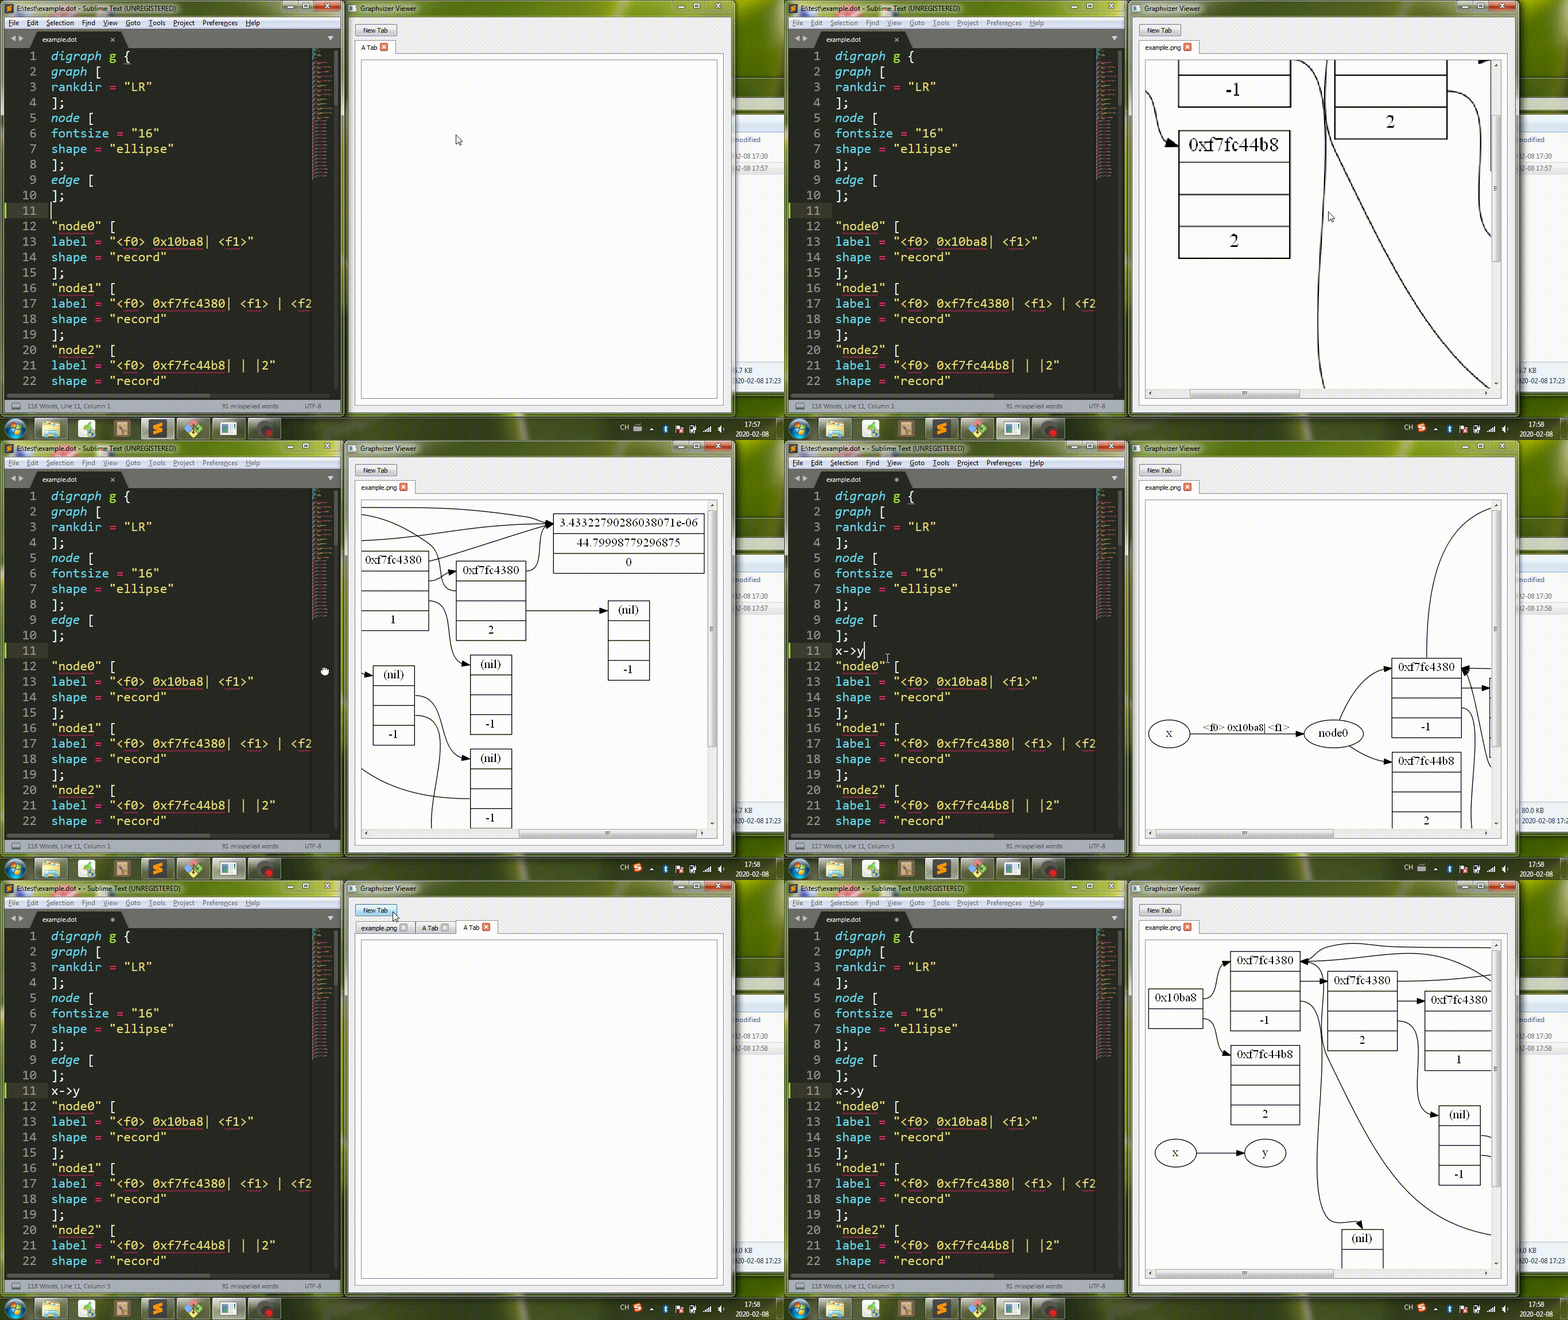
If you think viewing images in Sublime Text is very inconvenient because it doesn't support zooming or panning, you can try Graphvizer Viewer which is created as a supplement for Graphvizer.

Why did I create this plugin?
Graphviz is an awesome visualization tool, but it's very inconvenient to render images manually. I have to run dot file.dot -Tpng -o file.png again and again. Besides, I don't know whether the syntax is correct or not instantly. The Atom editor has an excellent plugin called “GraphViz preview+,” but I can't find any plugins like this on packagecontrol.io. Finally, I created Graphvizer.
Installation
1. Prerequisites
I can't implement the Graphviz visualization algorithm from scratch, so this plugin needs the dot command to render the image. In other words, you need to install the official Graphviz on your system.
For Linux/Mac
Use your operating system package manager (e.g. dnf, apt-get, or brew) to install Graphviz.
On my Fedora 27 X86_64, the command is:
sudo dnf install graphviz
Use
dot -Vto make sure you have configured all things correctly and you should see the version info of Graphviz.
For Windows
Download from here: https://graphviz.gitlab.io/download/. The installation is very simple but you need additional configuration to tell the plugin where to find the dot command.
Method 1: Add the path of dot.exe (e.g. D:\Graphviz\bin) to the PATH environment variable of your system. Then the dot command can be accessed from the command prompt (a.k.a. cmd) and this plugin can also invoke it. If you don't know how to do this, this article may help you.
Type
dot -Vin a Windowscmdwindow and hit enter. If everything is OK, you will see the version info of Graphviz.
Method 2: Specify the path of dot explicitly in plugin settings. See the full details in Configurations part.
2. Installing Graphvizer
Using Package Control (Recommended)
The easiest way to install Graphvizer is through Package Control.
Bring up the Command Palette (Ctrl+Shift+P on Linux/Windows, Cmd+Shift+P on Mac). Select Package Control: Install Package and then search for Graphvizer to install it.
Manually
git clone this project to your system or just download the zip file from GitHub and decompress it. Now you have a Graphvizer directory.
Using the Sublime Text 3 menu Preferences -> Browse Packages... to find out your package directory path. On my Windows 7, the path is D:\Sublime Text 3\Data\Packages. Move or symlink the entire Graphvizer directory into the package directory. Press Ctrl+Shift+P in Sublime and run Satisfy Dependencies. Restart Sublime. Done!
3. Upgrade
I will release a new version if someone reports a bug or if I have a new idea. You can use Package Control to upgrade this package.
Configurations
The default configurations are as follows. If you want to change some configuration, open Preferences -> Package Settings -> Graphvizer -> Settings and add configuration in the right side content according to your needs. The meaning of each configuration is explained below.
{
    // "dot_cmd_path" is the path of dot command. Here are some examples.
    // For Windows: "D:\\Graphviz\\bin\\dot.exe"
    // For Linux: "/usr/bin/dot"
    // For OSX: "/usr/bin/dot"
    // If you have added this path to the PATH environment variable, you can
    // use "dot" instead of the full absolute path.
    "dot_cmd_path": "dot",
    // If the dot command takes more than `dot_timeout` seconds, it will be
    // terminated. The default value is 3 seconds.
    "dot_timeout": 3,
    // "show_image_with" controls how to show the image.
    // The default value is "layout", so the image will be shown in a separated
    // layout by default. If you want to show it in a new window instead,
    // change the following value to "window". If you just want to show the image
    // in a new tab, change the value to "tab".
    "show_image_with": "layout",
    // "image_dir" controls where the image is saved.
    // The default value is "same" which means the image will be saved in the same
    // directory as the dot file.
    // If the value is "tmp", system temporary directory is used.
    // You can also set it to an arbitrary directory according to your needs.
    // Example for Windows: "E:\\homework\\image\\"
    // Example for Linux/OSX: "/home/haolee/image/"
    "image_dir": "same",
    // The default behavior is rendering the image in real time.
    // If set to false, the image will only be rendered when the file is saved.
    "render_in_realtime": true,
    // Default layout engine. Valid values including dot, neato, fdp, sfdp, twopi and circo.
    "default_layout_engine": "dot",
    // Default output format. Valid values including png, jpg, svg, pdf, gif, bmp, ps, ps2 and psd.
    // NOTE: the dot command also supports many other formats as detailed in the below link.
    // https://graphviz.gitlab.io/_pages/doc/info/output.html
    // You can certainly use any of them as the value of default_output_format, but these formats
    // won't be shown in Tools->Graphvizer->Output Format menu.
    "default_output_format": "png"
}
Set dot path
If you want to specify the path of you dot command, please set "dot_cmd_path" according to your system. This configuration is useful on Windows.
Set timeout for dot command
If you are editing a very large graph, the dot command may need a long time to complete and your CPU may be exhausted. For this reason, I set a timeout for dot command and it will be terminated if it takes too long to complete. You can change the timeout by setting "dot_timeout" as needed. Generally, you don't need to change this configuration.
Show the image in a new window
By default, the plugin will show the image in a separated layout.
You can also use a new window to show the image. Just change the value of "show_image_with" from "layout" to "window" and save it. This is flexible in some cases, especially when you have two monitors.
If your monitor is small, you may want to show the image in a new tab to save space. To do this, change the value to "tab".
(You may need to restart Sublime Text 3 to take effect.)
Set the image directory
By default, the value of "image_dir" is "same" which means the generated image will be saved in the same directory as the dot file. If the value is "tmp", the image will be saved in system temporary directory. If you want to change the location to another directory, you can set "image_dir" to any path according to your needs.
Example for Windows: "E:\\homework\\image\\"
Example for Linux/OSX: "/home/haolee/image/"
Render the image when the file is saved
By default, the image is rendered in real time. If you only want the image to be rendered when the file is saved, you can set "render_in_realtime" to false.
Set the default layout engine
By default, this plugin uses dot engine to render images just as you pass -Kdot argument to dot command. If you want to use other engines including neato, fdp, sfdp, twopi and circo, set "default_layout_engine" to the engine name.
Set the default output format
By default, the output format is png just as you pass -Tpng argument to dot command. If you want to use other formats including png, jpg, svg, pdf, gif, bmp, ps, ps2 and psd, set "default_output_format" to the format name.
Key Bindings
You can change the default key bindings through Preferences -> Package Settings -> Graphvizer -> Key Bindings. In the right side column of the opened window, set "keys" to other shortcuts according to your needs. The below example is for Windows.
[
    {
        "keys": ["ctrl+shift+g"],
        "command": "open_image",
        "context":
        [
            {"key": "selector", "operator": "equal", "operand": "source.dot"}
        ]
    },
    {
        "keys": ["ctrl+shift+x"],
        "command": "show_panel",
        "args": {"panel": "output.graphvizer_panel"},
        "context":
        [
            {"key": "selector", "operator": "equal", "operand": "source.dot"}
        ]
    }
]
To-Do List
- [x] Configure the
dotcommand path inSettings. - [x] Key Bindings for Window/Linux/OSX separately.
- [x] Add Preferences -> Package Settings menu items to custom user settings.
- [x] Being able to show the image in a separated layout.
- [x] Set timeout for
dotcommand. - [x] Being able to set the image directory.
- [x] Render the image when the file is saved.
- [x] Support specifying image output format
- [x] Supporting specifying layout engine
- [x] Introduce Graphvizer Viewer
- [x] Save the image in the same directory as the dot file by default
- [x] Set cwd for dot command to support shapefile attribute
- [ ] Integrate GraphvizerViewer with Graphvizer
- [ ] Extend dot language grammar to support variable definition, loop and if-else statements.
- For other features, please open an issue.
LICENSE
GNU GENERAL PUBLIC LICENSE Version 2 (GPLv2)
