PlotGraph
Sublime Text package to plot number columns as graphs
Details
Installs
- Total 2K
- Win 1K
- Mac 358
- Linux 213
| Feb 8 | Feb 7 | Feb 6 | Feb 5 | Feb 4 | Feb 3 | Feb 2 | Feb 1 | Jan 31 | Jan 30 | Jan 29 | Jan 28 | Jan 27 | Jan 26 | Jan 25 | Jan 24 | Jan 23 | Jan 22 | Jan 21 | Jan 20 | Jan 19 | Jan 18 | Jan 17 | Jan 16 | Jan 15 | Jan 14 | Jan 13 | Jan 12 | Jan 11 | Jan 10 | Jan 9 | Jan 8 | Jan 7 | Jan 6 | Jan 5 | Jan 4 | Jan 3 | Jan 2 | Jan 1 | Dec 31 | Dec 30 | Dec 29 | Dec 28 | Dec 27 | Dec 26 | |
|---|---|---|---|---|---|---|---|---|---|---|---|---|---|---|---|---|---|---|---|---|---|---|---|---|---|---|---|---|---|---|---|---|---|---|---|---|---|---|---|---|---|---|---|---|---|
| Windows | 0 | 0 | 0 | 0 | 0 | 0 | 0 | 0 | 0 | 0 | 0 | 0 | 0 | 0 | 0 | 0 | 0 | 0 | 0 | 0 | 0 | 0 | 0 | 1 | 0 | 0 | 0 | 0 | 0 | 0 | 0 | 0 | 0 | 0 | 0 | 0 | 0 | 0 | 0 | 0 | 0 | 0 | 0 | 0 | 0 |
| Mac | 0 | 0 | 0 | 0 | 0 | 0 | 0 | 0 | 0 | 0 | 0 | 0 | 0 | 0 | 0 | 0 | 0 | 0 | 0 | 0 | 0 | 0 | 0 | 0 | 0 | 0 | 0 | 0 | 0 | 0 | 0 | 0 | 0 | 0 | 0 | 0 | 0 | 0 | 0 | 0 | 0 | 0 | 0 | 0 | 0 |
| Linux | 0 | 0 | 0 | 0 | 0 | 0 | 0 | 0 | 0 | 0 | 0 | 0 | 0 | 0 | 0 | 0 | 0 | 0 | 0 | 0 | 0 | 0 | 0 | 0 | 0 | 0 | 0 | 0 | 0 | 0 | 0 | 0 | 0 | 0 | 0 | 0 | 0 | 0 | 0 | 0 | 0 | 0 | 0 | 0 | 0 |
Readme
- Source
- raw.githubusercontent.com
PlotGraph - A Sublime Text 3 Package
Plot a column of numbers as a graph, or create a quick curve comparison based on multiple number columns.
Installation
Requirements
- You need a python installation on your computer. The sublime-internal python is not sufficient.
That python environment needs to have the following modules installed:
The latter two are part of the python standard library and are probably available with a standard python installation.
To test if your python installation has a module installed, you can do the following:
- Open a terminal.
- Start python, e.g. by entering
pythonand hit [Enter]. - In the started python console, enter e.g.:
import matplotlib. - If this command finished without an error message you are all set.
Install Using Package Control (recommended)
- Install Package Control in Sublime Text. (How-To)
- Once Package Control is installed successfully, hit
[ctrl+shift+p]. - In the command line type something like
pa con in paand selectPackage Control: Install Packagefrom the drop down list. - In the search bar type
PlotGraphand hit[Enter]. - Done.
Manual Installation
- Download the zip archive.
- Extract the folder
PlotGraph-masterfrom the downloaded zip archive. - Rename the folder to
PlotGraph. - Copy the renamed folder into Sublime Text's
Packagesdirectory.
- If you are not sure where to find that directory,
  go to Sublime Text 3 `Menu > Preferences > Browse Packages...`.
  This should open a directory in you browser.
- Restart Sublime Text 3.
Setup
Once PlotGraph is installed, you need to set the path to your local python installation (in which matplotlib and the other modules are working).
Define Python Executable Path
- Open Sublime Text 3.
- In the menu navigate to
Preferences > Package Settings > PlotGraph > Settings - User. If you are accessing the PlotGraph user settings for the first time, that file will be empty. - To get a template for the possible settings, open
Preferences > Package Settings > PlotGraph > Settings - Default. - Copy the content of the default PlotGraph settings to the empty user settings file.
Replace the default value for
python_execwith the path to your python executable. The content of your PlotGraph user setting file should look somewhat like this:{ "python_exec" : "<path to your python executable>" }
Save and close the PlotGraph user settings file.
Set Key Bindings
If your are not happy with using [ctrl+alt+g] as the short cut to
generate the plot, you can change the key binding:
- Open Sublime Text 3.
- In the menu navigate to
Preferences > Package Settings > PlotGraph > Key Bindings - Default. - Copy the line
{"keys": ["ctrl+alt+g"], "command": "plot_graph"}to your user key binding settings. You can open the user key bindings file viaPreferences > Package Settings > PlotGraph > Key Bindings - User. - In the user key bindings file, replace the
ctrl+alt+gin["ctrl+alt+g"]with whatever short cut you prefer. - Save and close the user key bindings file.
Usage
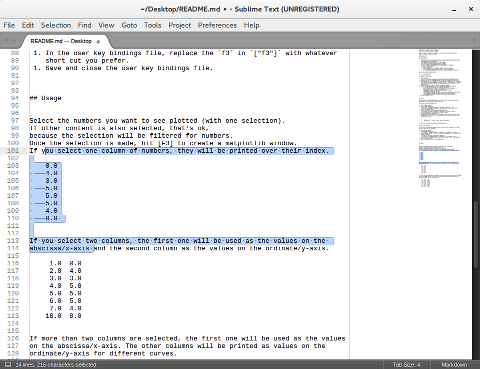
Select the numbers you want to see plotted (with one selection).
If other content is also selected, that's ok,
because the selection will be filtered for numbers.
Once the selection is made, hit [ctrl+alt+g] to create a matplotlib window.
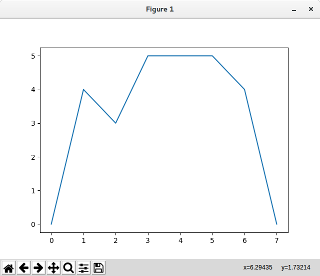
If you select one column of numbers, they will be printed over their index.
0.0
4.0
3.0
5.0
5.0
5.0
4.0
0.0


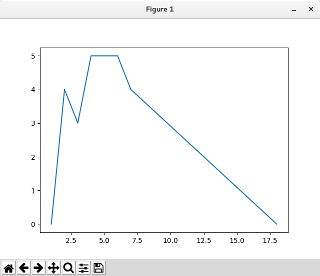
If you select two columns, the first one will be used as the values on the abscissa/x-axis and the second column as the values on the ordinate/y-axis.
1.0  0.0
 2.0  4.0
 3.0  3.0
 4.0  5.0
 5.0  5.0
 6.0  5.0
 7.0  4.0
18.0  0.0

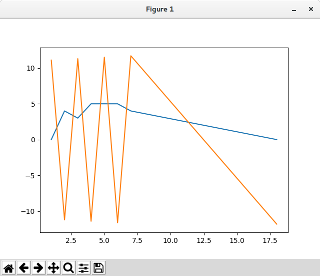
If more than two columns are selected, the first one will be used as the values on the abscissa/x-axis. The other columns will be printed as values on the ordinate/y-axis for different curves.
1.0  0.0   11.1
 2.0  4.0  -11.2
 3.0  3.0   11.3
 4.0  5.0  -11.4
 5.0  5.0   11.5
 6.0  5.0  -11.6
 7.0  4.0   11.7
18.0  0.0  -11.8

Issues
Please report issues at Github.
