Debugger
Graphical Debugger for Sublime Text for debuggers that support the debug adapter protocol
Details
Installs
- Total 24K
- Win 12K
- Mac 6K
- Linux 7K
| Jul 25 | Jul 24 | Jul 23 | Jul 22 | Jul 21 | Jul 20 | Jul 19 | Jul 18 | Jul 17 | Jul 16 | Jul 15 | Jul 14 | Jul 13 | Jul 12 | Jul 11 | Jul 10 | Jul 9 | Jul 8 | Jul 7 | Jul 6 | Jul 5 | Jul 4 | Jul 3 | Jul 2 | Jul 1 | Jun 30 | Jun 29 | Jun 28 | Jun 27 | Jun 26 | Jun 25 | Jun 24 | Jun 23 | Jun 22 | Jun 21 | Jun 20 | Jun 19 | Jun 18 | Jun 17 | Jun 16 | Jun 15 | Jun 14 | Jun 13 | Jun 12 | Jun 11 | Jun 10 | |
|---|---|---|---|---|---|---|---|---|---|---|---|---|---|---|---|---|---|---|---|---|---|---|---|---|---|---|---|---|---|---|---|---|---|---|---|---|---|---|---|---|---|---|---|---|---|---|
| Windows | 0 | 7 | 4 | 4 | 6 | 8 | 3 | 4 | 3 | 4 | 2 | 4 | 2 | 1 | 0 | 4 | 2 | 3 | 6 | 1 | 7 | 2 | 14 | 4 | 1 | 6 | 4 | 4 | 2 | 6 | 5 | 3 | 5 | 3 | 1 | 2 | 3 | 1 | 6 | 1 | 1 | 3 | 8 | 7 | 0 | 3 |
| Mac | 0 | 2 | 0 | 2 | 3 | 1 | 1 | 1 | 2 | 3 | 5 | 4 | 4 | 0 | 7 | 1 | 1 | 3 | 1 | 0 | 3 | 0 | 2 | 0 | 1 | 1 | 3 | 1 | 2 | 4 | 3 | 4 | 2 | 1 | 0 | 2 | 1 | 2 | 1 | 0 | 3 | 3 | 0 | 0 | 5 | 1 |
| Linux | 0 | 2 | 3 | 2 | 2 | 2 | 3 | 2 | 3 | 2 | 1 | 7 | 3 | 0 | 3 | 2 | 4 | 1 | 2 | 4 | 1 | 1 | 2 | 2 | 0 | 2 | 6 | 2 | 0 | 1 | 4 | 1 | 2 | 1 | 1 | 3 | 1 | 3 | 0 | 2 | 5 | 3 | 2 | 3 | 2 | 2 |
Readme
- Source
- raw.githubusercontent.com
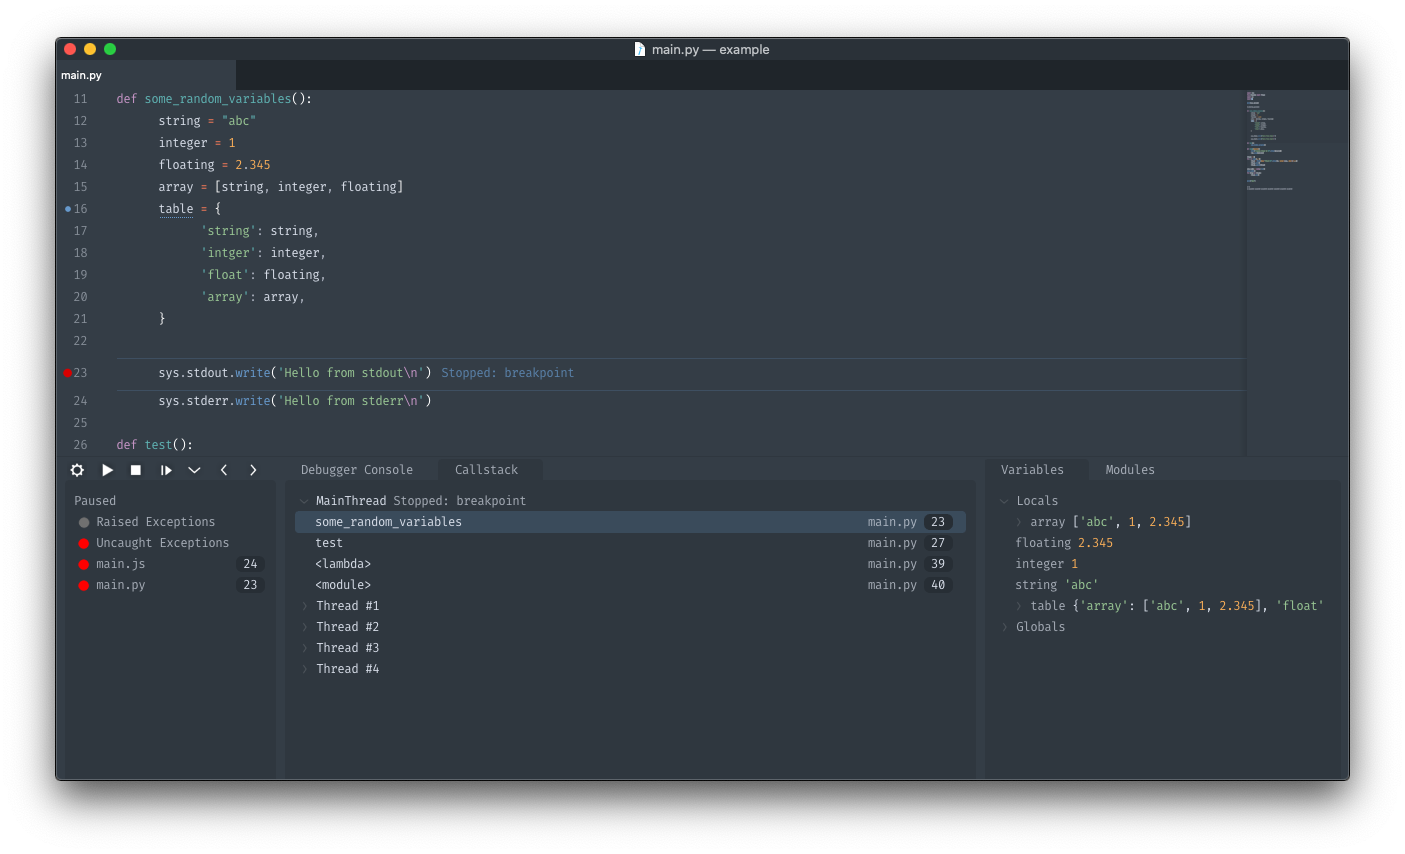
Sublime Debugger
Graphical Debugger for sublime text for debuggers that support the debug adapter protocol.
Installing
Using package control run Package Control: Install Package and select Debugger.
or clone into your sublime Packages directory (If you are on Sublime Text 3 use the st3 branch)
Getting Started
This project attempts to match Visual Studio Code's Debugger fairly closely so their documentation can be pretty helpful. See https://code.visualstudio.com/docs/editor/debugging
Debuggers
This project comes with some pre-configured debuggers (They can be installed using Debugger: Install adapters)
LLDB
Chrome
Firefox
Node
- For an overview see https://code.visualstudio.com/docs/nodejs/nodejs-debugging
- See https://github.com/microsoft/vscode-node-debug2
Python
- For an overview see https://code.visualstudio.com/docs/python/debugging
- See https://github.com/Microsoft/vscode-python
Go
- For an overview see https://github.com/golang/vscode-go/blob/master/docs/debugging.md
- See https://github.com/golang/vscode-go
PHP
Java
- Requires LSP and LSP-jdtls
- See https://github.com/redhat-developer/vscode-java
Emulicious Debugger
Setup
Open the debug panel
- from the command palette
Debugger: Open
- from the command palette
Install a debug adapter by running:
Debugger: Install adapterfrom the command palette.Add a configuration
Debugger: Add Configurationfrom the command palette (or add one manually, see below).- Configurations are added to
debugger_configurationsto your sublime-project and use the same configuration format as Visual Studio Code - Consult the debugger specific documentation links above for creating a configuration for your debugger. Most debuggers come with some configuration snippets to choose from but I highly recommend looking at the documentation for the debugger.
- Variable substitution: variables like
${file}are supported but the list of supported variables differs from VSCode. The supported values are those listed at http://www.sublimetext.com/docs/build_systems.html#variables plus the VSCode-specific${workspaceFolder}that resolves to the path of the first workspace folder.
- Configurations are added to
Your configuration will look something like the following but with some debugger specific fields.
"debugger_configurations" : [
    {
        "name" : "Name of your configuration",
        "request" : "launch"|"attach",
        "type" : "debugger name",
         ...
    }
]
- Start debugging
- click the gear icon to select a configuration to use
- click the play icon to start the debugger or run
Debugger: Start(if no configuration is selected it will ask you to select or create one)
Tasks
Tasks are based on sublime build_systems with more integration so they can be used more seamlessly while debugging. When errors occur while running a task they are reported in the debugger ui (problem detection is the same as sublime, you must add file_regex to your task)
see https://www.sublimetext.com/docs/build_systems.html
Tasks are basically the same as sublime builds but there are a few additional parameters.
name which will show up in the debugger UI and be the name of the panel
"debugger_tasks" : [
    {
        "name" : "Name of your task",
        "cmd" : ["task", "command"],
         ...
    }
]
- Tasks can be run with
Debugger: Run Tasks - You can run tasks before and after debugging by adding
pre_debug_taskorpost_debug_taskto your configuration specifying the name of the task to run.
Settings
Settings can be adjusted with Preferences: Debugger Settings
for a full list of settings see debugger.sublime-settings
Troubleshooting
- To fix issues with things aligning correctly or the last panel not being visible try adjusting the
internal_font_scaleandinternal_width_modifierin the settings - Look in the debug console for errors (usually red)
- Look in the sublime console for errors
- Try the same configuration/adapter in Visual Studio Code (There is a good chance your issue is with the adapter so check out the outstanding issues for it)